
EV battery charging: power, charging curves and charging time
An EV’s charging power changes as the battery fills and its temperature changes. The charging curve shows how the battery, vehicle and station limits interact, and helps explain how long a charging stop takes.
How AC and DC power reach the battery
Charging supplies electrical energy that the battery stores as chemical energy. Electrons flow through the external circuit while ions move inside the cells; Battery basics explains those reactions. The battery receives direct current (DC), whether the vehicle is connected to an AC charge point or a DC station. US Department of Energy: DOE Explains Batteries

Ion and electron movement during battery charging
During AC charging, the vehicle’s onboard charger converts alternating current into DC for the high-voltage battery. The wallbox supplies a controlled AC connection; the conversion takes place in the car. US Department of Energy: How all-electric cars work An 11 kW onboard charger therefore cannot draw 22 kW from a 22 kW AC charge point. Available phases, the installation’s current limit and the vehicle’s settings can reduce power further.
A grid-fed DC station performs the main AC-to-DC conversion outside the car and supplies regulated DC through the charge port, bypassing the onboard AC charger. Some vehicles then use an onboard DC voltage converter or electrically reconfigure the pack to match the station’s voltage range, as described below.
The vehicle and station coordinate delivery throughout the session. In CCS charging, communication establishes operating limits, and electrical checks and voltage matching take place before high-current charging starts. The station adjusts its output to the vehicle’s requests within its own capabilities. CharIN: Combined Charging System design guide V7
This chapter concentrates on battery acceptance and charging performance. The EV charging series covers connectors, home installations and public charging.
Energy, power and charging time
Power in kilowatts describes the rate of energy transfer; energy in kilowatt-hours describes the amount transferred. The measurement point matters: grid input, DC station output, battery-terminal input and the increase in stored battery energy are different quantities.
A DC station’s transaction meter measures electrical energy delivered at the vehicle connection, rather than chemical energy retained in the cells. OIML G 22: Electric vehicle supply equipment metrology Conversion and resistive losses consume energy along the path, while battery heating, cooling and other vehicle systems use part of the incoming power. Charging loss explains these boundaries in detail.
For a consistent measurement point and time interval:
Average power (kW) = energy transferred (kWh) ÷ elapsed time (h)
As a hypothetical example, a DC station delivers 49 kWh over 18 minutes, or 0.3 hours. Its average output is 49 ÷ 0.3 = approximately 163 kW. Even if output briefly reaches 250 kW, the session average remains 163 kW. The battery’s stored-energy increase will be smaller than the station’s delivered energy.
If the 49 kWh instead describes an increase in stored battery energy, the same calculation gives the average rate of energy storage. It cannot then be compared directly with a peak measured at the station output.
A displayed state-of-charge (SOC) change also needs care. Multiplying a 70-percentage-point increase by a quoted battery capacity gives an estimate, not a measurement of transferred energy. SOC is an estimate of charge, and voltage varies through the operating window. Gross capacity includes energy outside the driver-accessible window. EVKX uses net (usable) capacity for the energy within that window. Battery capacity and buffers explains EVKX’s capacity definitions, including the reserve below displayed 0%. The distinction between charge and energy is explained in Battery basics.
What shapes the charging curve
A charging curve usually plots power against displayed SOC. Its shape reflects whichever restriction is active at each point: the battery’s permitted current, vehicle hardware, station output or temperature control.
The station has separate power, voltage and current limits. Its advertised kilowatt rating is available only within the combinations those limits allow. Power sharing at the site and thermal limits in the cable or station can reduce output during a session. DC fast charging covers these station-side restrictions. CharIN’s DC power-class document illustrates why a power rating needs an accompanying voltage-current operating range. CharIN: DC CCS power classes V7.2
On the vehicle side, the battery management system monitors cell-group voltages, pack current and temperatures. Texas Instruments: EV battery-management systems In CCS charging, the charging controller uses the resulting operating limits to request current and voltage from the station. CharIN: Combined Charging System design guide V7 A cell group approaching its voltage limit can constrain the whole pack; Cell balancing explains how charge differences contribute. An overheated component can also limit the session. Battery management system explains the monitoring and control decisions.
Rising power and plateaus
At low SOC, the battery may have substantial voltage headroom, but a cold pack or a current-limited station can still restrict power. Initial communication and current ramp-up also mean the first seconds may look different from the rest of the curve.
At approximately constant current, rising battery voltage produces rising power. If the station or vehicle instead holds power constant, current falls as voltage rises. A broad power plateau can therefore conceal a changing current.
Why power tapers
As charging proceeds, cell voltages approach their permitted upper limits. Reducing current limits the voltage rise under load and allows charging to continue. This reduction is called taper. During voltage-limited charging, falling current also reduces power, which explains why the final percentages can take disproportionately long. Conventional lithium-ion charging uses a current-controlled phase followed by voltage-limited charging, although EVs can use more complex profiles. Microchip AN947: Lithium-ion battery charging fundamentals
Cell constraints can also require lower current before the upper voltage limit is reached. Lithium transport and electrode reactions must keep pace with incoming charge. Excessive current, especially in a cold graphite-based cell, can deposit metallic lithium on the negative electrode. Research by Rodrigues and colleagues shows that the charging conditions that avoid plating depend on temperature, electrode design and the charging protocol. Rodrigues et al.: Fast Charging of Li-Ion Cells, Part IV The mechanism is covered in Cell chemistry and components.
A step or dip in power does not identify its cause by itself. It could reflect a programmed current reduction, battery cooling limits or a station restriction. Diagnosing it requires voltage, current, temperature and charger information alongside the power curve.
Temperature before and between stops
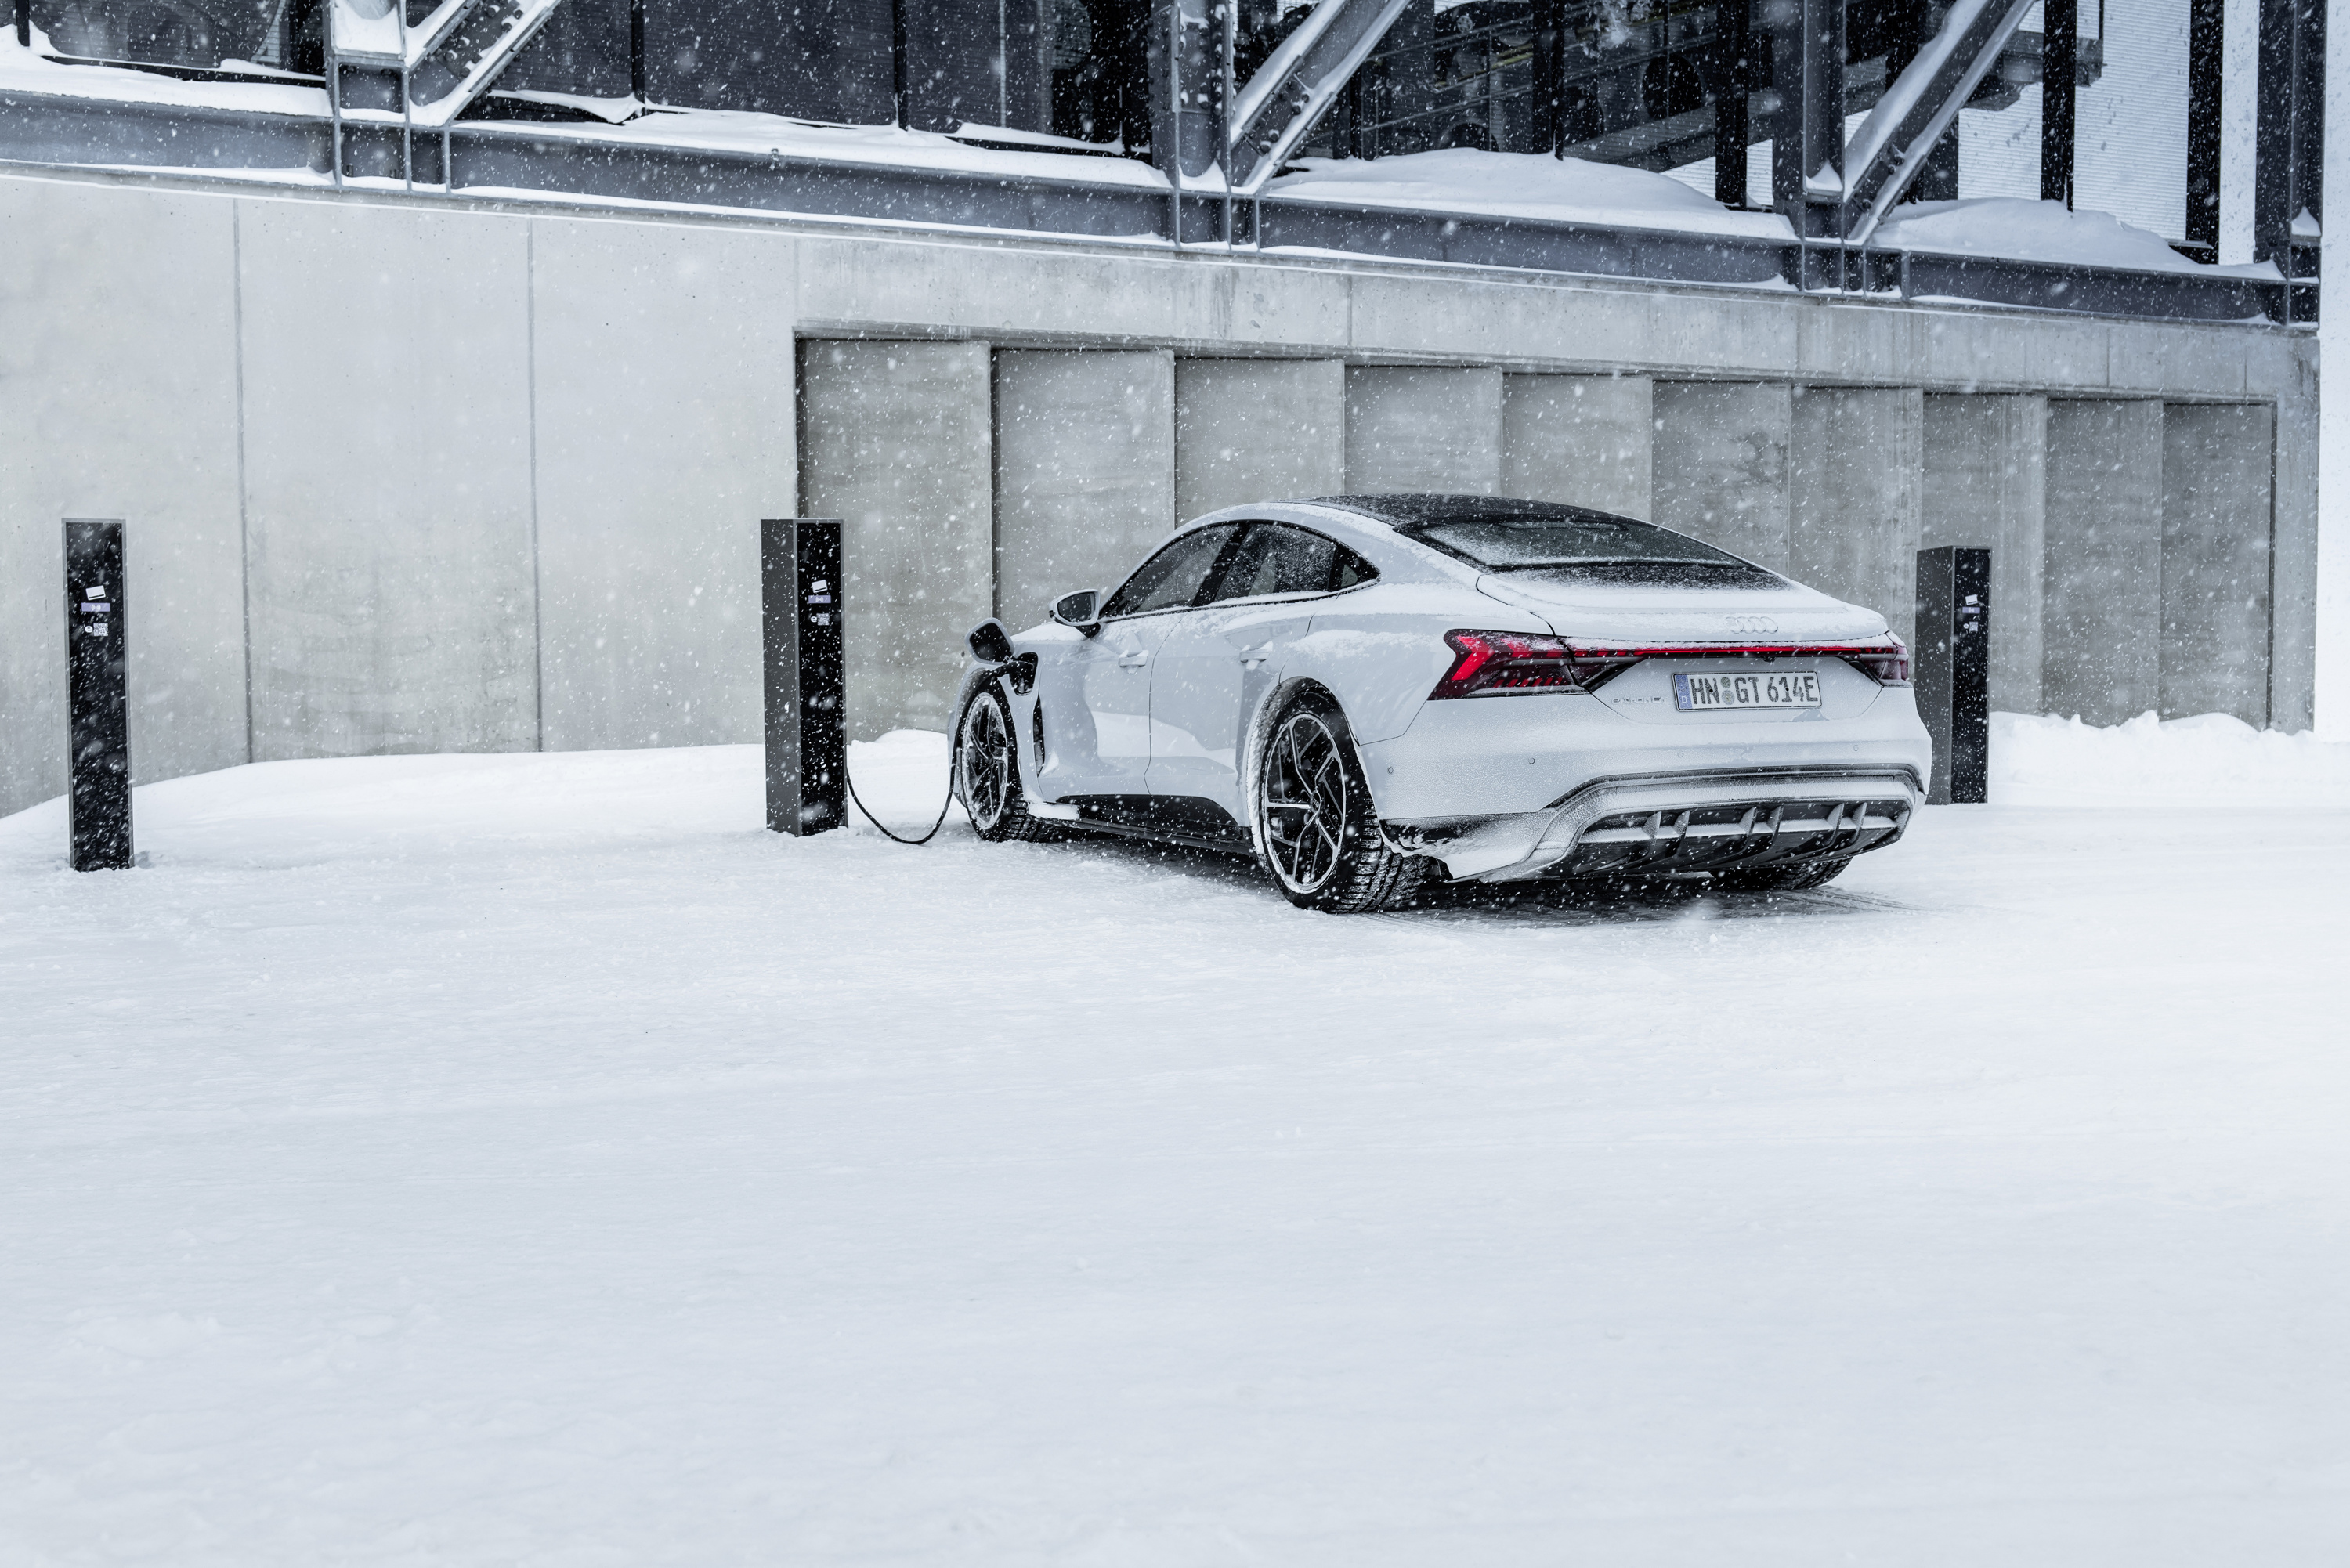
Preconditioning for fast charging heats or cools the battery before a planned stop. Navigation-based preparation gives the thermal system time to act before arrival; some vehicles also offer manual activation. A departure timer may prepare the cabin and battery for driving, which is a different target from preparation for high-power charging. Tesla’s Model 3 manual, for example, describes departure preparation and route-based battery heating for charging separately. Tesla Model 3 manual: cold-weather preparation
The battery also needs to manage the heat generated during the session. DOE’s fast-charging assessment identifies heat removal and temperature control as central challenges for fast charging. US Department of Energy: Enabling Fast Charging On later stops, starting temperature and remaining cooling capacity may differ from those at the first stop. Battery thermal management covers the heating, cooling and repeated-stop behaviour in detail.
Voltage, current and charger compatibility
For DC power at a given point in the charging path:
Power (kW) = voltage (V) × current (A) ÷ 1,000
The following calculated examples assume the equipment can supply 500 A at each stated voltage:
| Actual DC voltage | Power at 500 A |
|---|---|
| 400 V | 200 kW |
| 800 V | 400 kW |
| 1,000 V | 500 kW |
An “800-volt” architecture is a voltage class. The battery’s actual voltage changes with SOC and operating conditions. At an actual 700 V, a 500 A station can supply at most 350 kW, even if its advertised maximum power is higher.
Higher voltage allows the same power to pass through the charging cable at lower current, a relationship discussed in DOE’s fast-charging assessment. US Department of Energy: Enabling Fast Charging For unchanged conductor resistance, the lower current reduces resistive heating according to I²R. The cell design still determines how much charging current each cell can accept. Battery pack and configuration explains how series and parallel connections establish pack voltage and capacity.
For a concrete current requirement, XPENG’s German configurator lists 542 kW for the X9 FWD Long Range with a 110 kWh gross NCM battery and an 800 V architecture. XPENG Germany: X9 configurator At an assumed actual 800 V, 542 kW requires approximately 678 A. At a lower voltage it requires more current.
Charging from a lower-voltage station
A station whose maximum output voltage is below the battery’s required charging voltage needs help from the vehicle. There are two main approaches: raise the incoming voltage, or change the pack’s electrical configuration.
A dedicated DC-DC boost converter raises station voltage to the level required by the pack. Some designs reuse traction components for this task: Hyundai’s 2020 E-GMP announcement describes using the motor and inverter to boost a 400 V charging input for its 800 V system. Hyundai: E-GMP electric platform Converter capability, losses and heat generation then become part of the charging limit.
Bank charging changes the electrical connection between pack sections. Audi’s Q6 e-tron documentation describes switching its 800-volt-class battery into two lower-voltage banks that charge in parallel. Audi specifies up to 135 kW total in this mode. Audi: charging technologies and Q6 e-tron bank charging Porsche’s 2024 Macan description gives the same 135 kW total for bank charging without an additional high-voltage booster, compared with up to 270 kW on suitable high-voltage equipment. Porsche: Macan charging technology
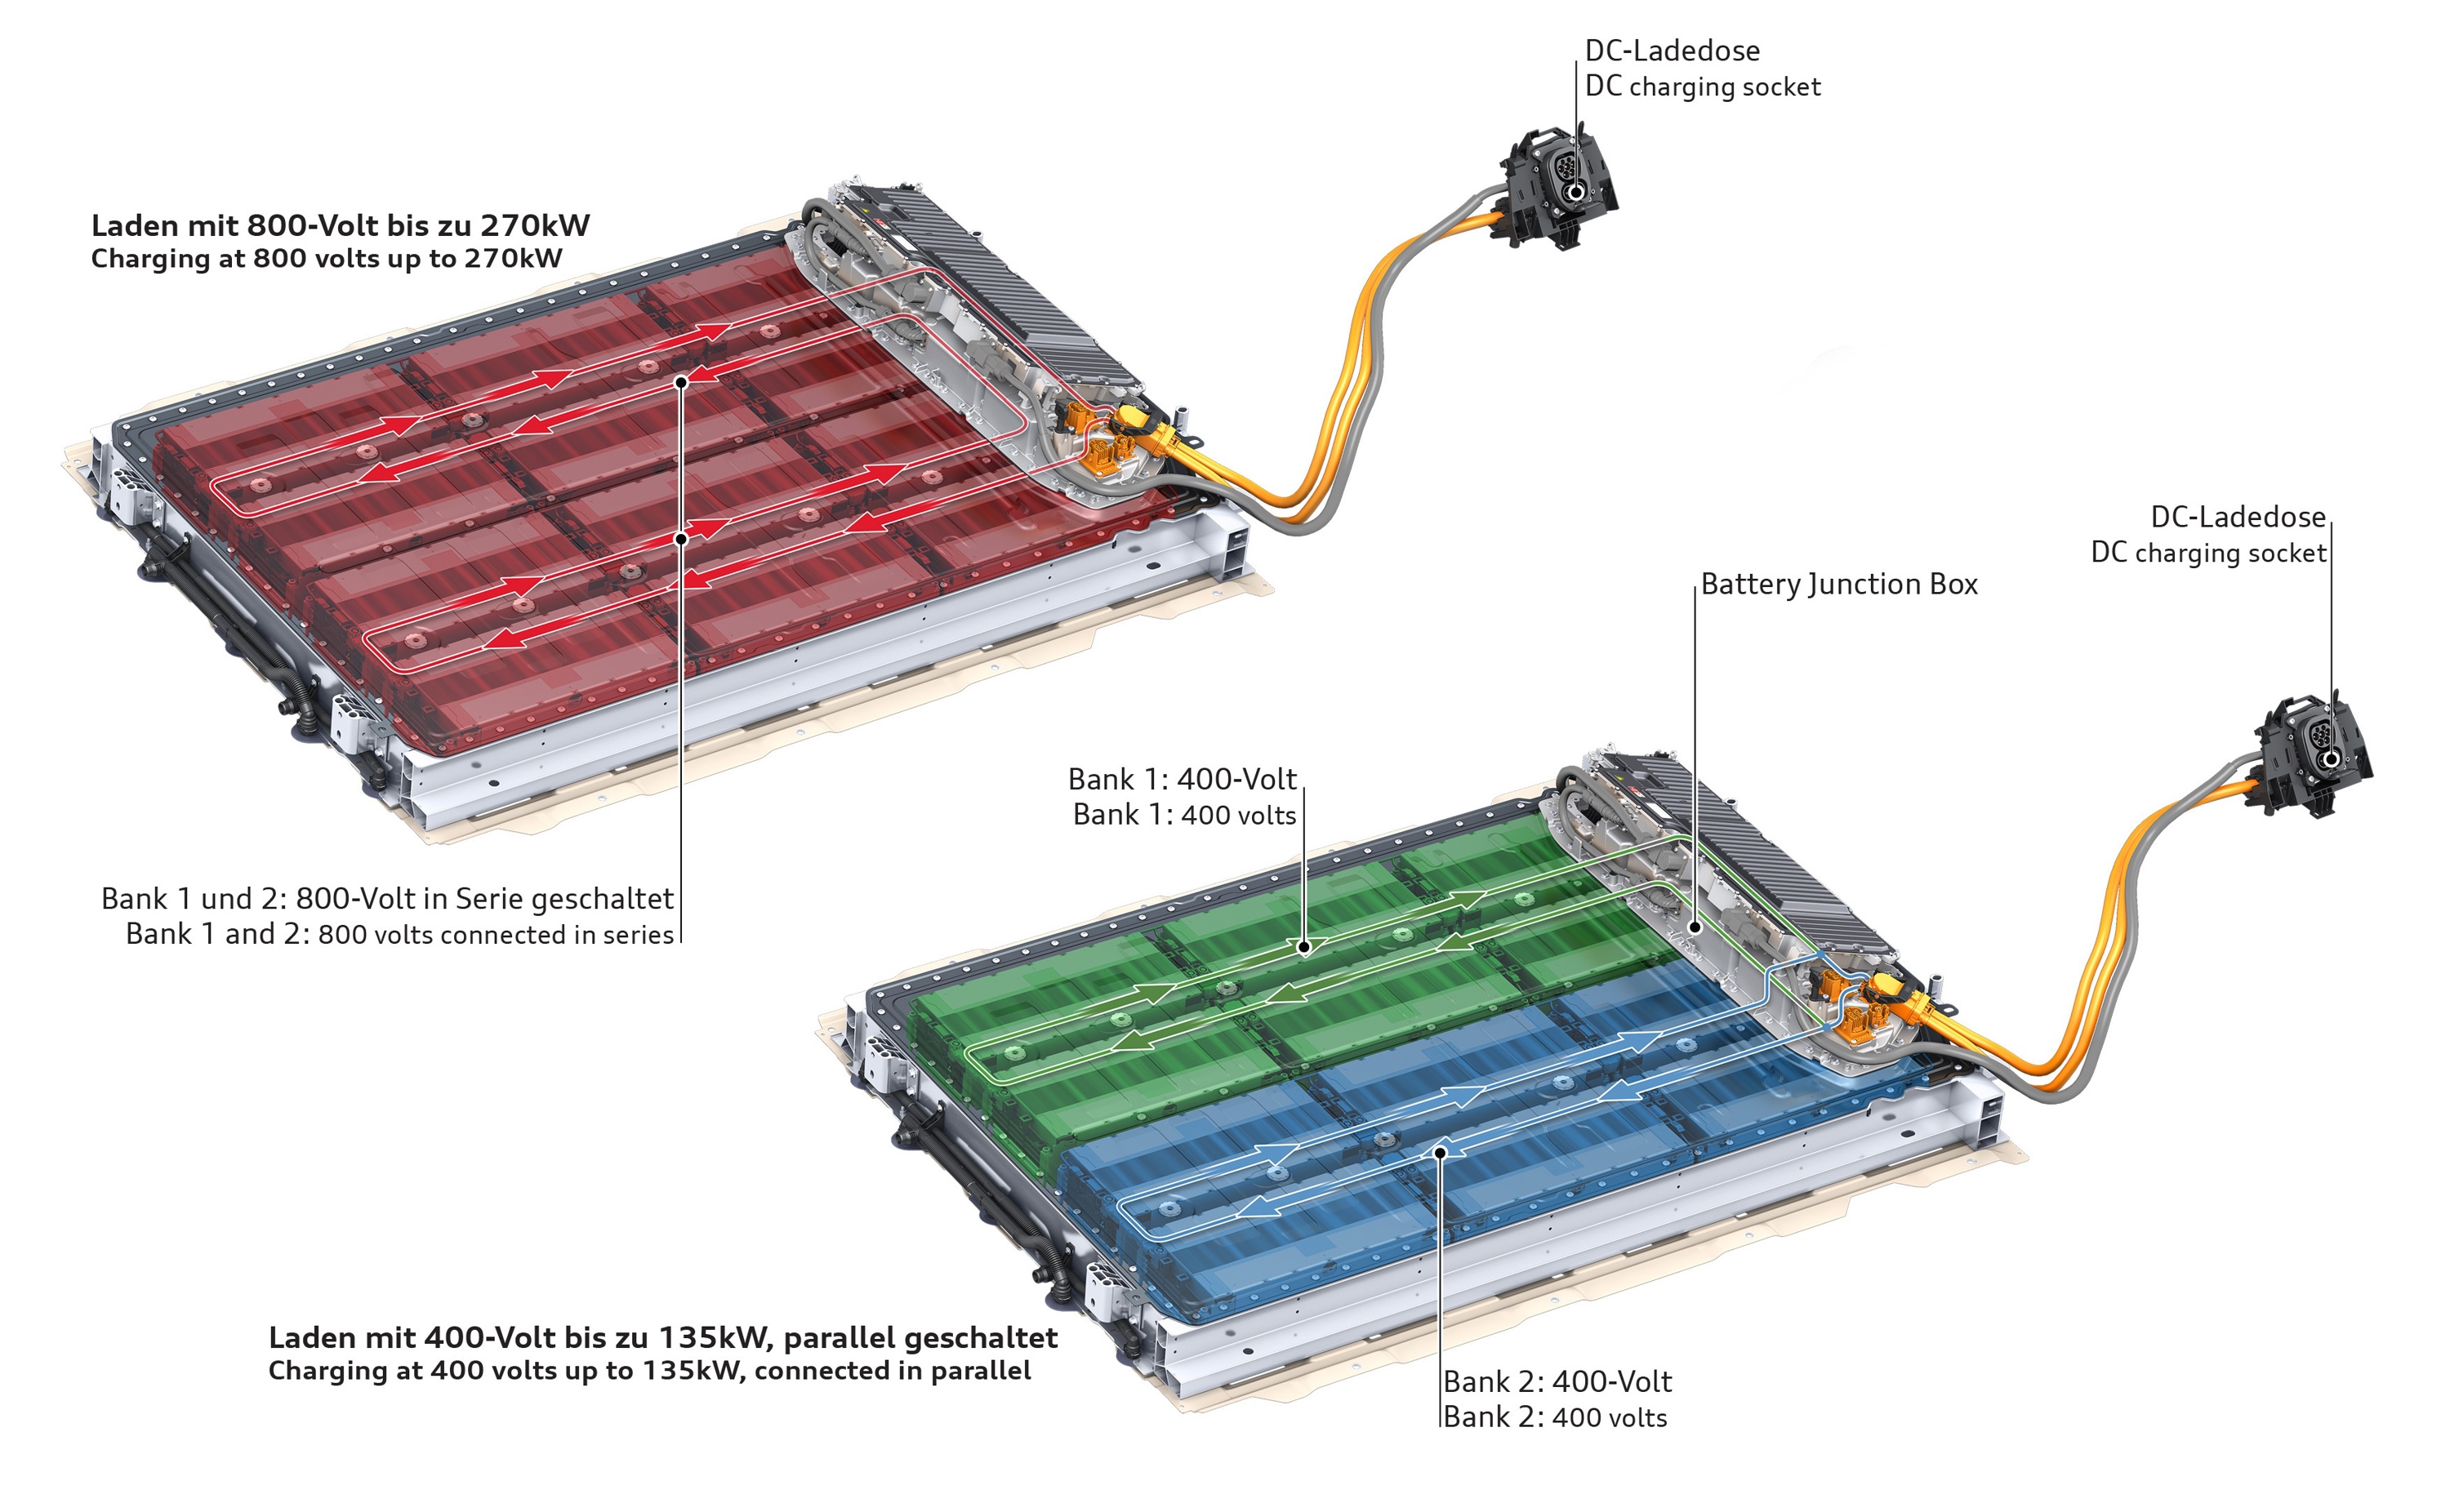
For either conversion or bank charging, compatibility with a lower-voltage station can come with a different power limit from the vehicle’s headline peak.
What C-rate tells you
C-rate expresses charging or discharging current relative to a battery’s reference capacity in ampere-hours. Microchip AN947: Lithium-ion battery charging fundamentals
C-rate = current (A) ÷ reference capacity (Ah)
For a hypothetical 100 Ah battery, 100 A is 1C, 250 A is 2.5C and 500 A is 5C. A constant 1C current would transfer the reference charge in one hour. A peak 5C rating does not promise a full EV charge in 12 minutes: taper and the permitted operating window determine the actual session.
When only power and energy capacity are available, dividing kW by kWh gives a power-to-energy ratio in inverse hours. This is often used as an approximate C-rate. For example, 250 kW divided by 100 kWh gives 2.5 h⁻¹.
The approximation works best when power and capacity describe the same battery and actual voltage is close to the nominal voltage used to calculate its energy rating. At constant current, rising voltage increases kW/kWh even though the current-based C-rate stays constant. Gross and net energy capacities also produce different ratios, so name the denominator.
C-rate helps compare charging intensity across battery sizes. At a given C-rate, whether charging avoids lithium plating depends on electrode design and temperature. Rodrigues et al.: Fast Charging of Li-Ion Cells, Part IV Reference capacity, current limits and test conditions need to be specified for a meaningful comparison. Maccor: understanding C-rate in battery testing
Comparing charging performance
Compare the exact battery variant, SOC interval, energy added and elapsed charging time together. A 20–80% result starts later than a 10–80% result, and two cars charging through the same percentage interval may store very different amounts of energy.
XPENG’s German X9 FWD Long Range specification pairs its 542 kW peak claim with 20–80% in 10 minutes. XPENG Germany: X9 configurator
Station and vehicle claims also need separate labels. In its 13 March 2026 Z9GT announcement, BYD described a Flash Charging station capable of up to 1,500 kW through one Chinese-market connector. It separately advertised 10–70% in five minutes and 10–97% in nine minutes for the new system. The station rating alone does not establish a 1,500 kW vehicle peak or the average power during either interval. The European-launch announcement did not specify European station capability or a detailed test protocol for those times. BYD: Denza Z9GT Flash Charging announcement
For a published charging curve or test, check:
- The exact vehicle, battery version and software, plus whether the curve is measured, manufacturer-supplied or estimated.
- The SOC interval, elapsed time and measurement point for power and energy.
- Station voltage, current and power capability, including any sharing or derating.
- Battery preparation and ambient conditions, and whether the result covers one session or repeated stops.
These checks also apply to EVKX variant curves. An estimated curve and a measured session provide different evidence, and missing test conditions limit how closely a result can be reproduced.
Connecting charging to driving distance
For journey comparisons, use energy available for driving and consumption on the same battery-energy basis. Charger-delivered kilowatt-hours need an allowance for charging losses before being used in this calculation.
In a hypothetical 20-minute stop, car A gains 60 kWh of usable battery energy and subsequently consumes 30 kWh/100 km. That energy supports 200 km. Car B gains 50 kWh in the same time and consumes 20 kWh/100 km, supporting 250 km.
Car A stores energy faster; car B adds more driving distance during the stop under those assumptions. Matching consumption to the expected speed, weather and load makes this comparison useful for planning a journey.
Sources
16
- US Department of Energy: DOE Explains Batteries — chemical energy storage and charge movement.
- US Department of Energy: How all-electric cars work — onboard AC conversion and vehicle components.
- CharIN: Combined Charging System design guide V7 — CCS communication and charging sequence; 2019 design guide.
- OIML G 22: Electric vehicle supply equipment metrology — delivered-energy measurement at the vehicle connection.
- CharIN: DC CCS power classes V7.2 — voltage-current operating ranges; version 7.2, December 2021.
- Texas Instruments: EV battery-management systems — cell and pack monitoring.
- Microchip AN947: Lithium-ion battery charging fundamentals — current-based C-rate and voltage-limited charging; 2004 application note for portable lithium-ion cells.
- Rodrigues et al.: Fast Charging of Li-Ion Cells, Part IV — temperature, electrode design and charging limits.
- Tesla Model 3 manual: cold-weather preparation — preparation for departure and fast charging.
- US Department of Energy: Enabling Fast Charging — electrical and thermal constraints; 2017 technology assessment.
- Hyundai: E-GMP electric platform — motor/inverter voltage boosting, December 2020.
- Audi: charging technologies and Q6 e-tron bank charging — Q6 e-tron bank charging.
- Porsche: Macan charging technology — Macan charging modes, June 2024.
- XPENG Germany: X9 configurator — German FWD Long Range specification, checked October 2026.
- Maccor: understanding C-rate in battery testing — reference capacity and test conditions.
- BYD: Denza Z9GT Flash Charging announcement — station capability and advertised charge windows, March 2026.