
Understanding EV Range
An electric car does not have one fixed range. It has stored energy, a changing demand for energy, and several test procedures that turn controlled measurements into different certified numbers.
The shortest useful range equation
The basic relationship is simple:
range = usable battery energy / average energy consumption per unit of distance
If a car can deliver 75 kWh to propulsion and auxiliaries, and the trip requires 20 kWh/100 km, the calculated range is 375 km. The difficulty lies inside both inputs.
“Battery capacity” may mean:
- gross chemical capacity;
- net driver-accessible capacity from a fully charged battery until propulsion stops;
- displayed 100-to-0 capacity, which can exclude a reserve available after the display reaches 0%;
- the energy actually discharged during a certification test;
- energy drawn from the electricity grid when the battery is recharged.
Those quantities are related, but they are not interchangeable. Charging losses, battery temperature, protective buffers, cell balancing and the point at which the test is terminated can all separate one value from another.
Consumption is just as conditional. It depends on the speed trace, stops, acceleration, road load, cabin heating, battery conditioning, wind, rain, elevation and the efficiency of the powertrain at each operating point. A certified range therefore answers a narrow question: how far did this vehicle configuration calculate to travel under a defined procedure?
What counts as an empty battery?
Displayed 0%, the end of a range test and the battery’s protective lower limit are different boundaries. The dashboard state of charge is a software-defined scale. It can reach 0% while the vehicle still has a small driving reserve, or it can be calibrated close to the point where propulsion is restricted.
A certification test does not normally continue to electrochemical zero. Deep discharge can damage lithium-ion cells, so the battery-management system keeps cell voltage above a protective floor. The test instead ends at a defined operational break-off criterion.
In the WLTP shortened procedure, the break-off point is reached when the vehicle can no longer remain within the prescribed speed tolerance for four consecutive seconds during the final constant-speed depletion segment. EPA testing under SAE J1634 likewise uses the vehicle’s ability to follow the required driving trace as the practical endpoint. China’s CLTC procedure also uses a defined test-termination condition rather than treating dashboard 0% as a universal physical boundary. See the detailed How WLTP EV range is calculated, How EPA EV range and efficiency are calculated and How CLTC EV range is calculated chapters.
If an EV reaches displayed 0% but can still follow the prescribed trace, the energy used after 0% can be included in test-measured usable energy. Energy protected below the propulsion cutoff is not. Near empty, the endpoint can also depend on demanded power: a weak battery may sustain low-speed driving while voltage sag prevents it from meeting a harder acceleration or speed target.
This creates five useful boundaries:
- gross or total battery energy;
- the upper protective buffer;
- displayed 100-to-0 energy;
- any driving reserve available after displayed 0%;
- the lower protective buffer below the propulsion cutoff.
“Usable capacity” is incomplete unless the source explains which of these boundaries it uses.
BMW iX3: one pack, three capacity descriptions
The BMW iX3 50 xDrive shows why regional capacity figures should not be treated as direct evidence of different depletion limits.
BMW’s preliminary September 2025 U.S. specification table listed 112.2 kWh as “net usable energy content,” but the same table was marked “preliminary – subject to change.” BMW USA: Preliminary BMW iX3 50 xDrive specifications BMW’s April 2026 global information states that the iX3 50 xDrive provides 108.7 kWh of usable energy for the German-market WLTP result. BMW Group: BMW iX3 50 xDrive usable battery energy BMW’s current U.S. consumer page instead calls 112.3 kWh the battery’s total capacity. BMW USA: BMW iX3 model overview and battery specification
The arithmetic difference between the current 112.3 kWh total figure and the 108.7 kWh usable figure is 3.6 kWh, about 3.2% of the stated total. That gap could include upper and lower protective margins, rounding and differences in how the fields are defined. It does not establish how much energy, if any, is available after displayed 0%.
The earlier 112.2 kWh U.S. entry is a manufacturer specification, not a published EPA measurement showing that the American test discharged 3.5 kWh deeper. The later change from “net usable” to “total capacity” makes a terminology or preliminary-data revision more plausible than a test-cycle explanation. Even identical pack hardware could receive different software limits in different markets, but these sources do not demonstrate such a calibration difference.
A higher advertised usable capacity in one market does not prove that the vehicle provides more energy below displayed 0%. A below-zero reserve can be established only through a controlled discharge test, battery-management data or explicit manufacturer documentation.
From forces to battery energy
At every instant, the tyres must produce enough force to overcome aerodynamic drag, rolling resistance, gradients and acceleration.
Aerodynamic drag can be approximated as:
F_aero = 0.5 × air density × drag coefficient × frontal area × speed²
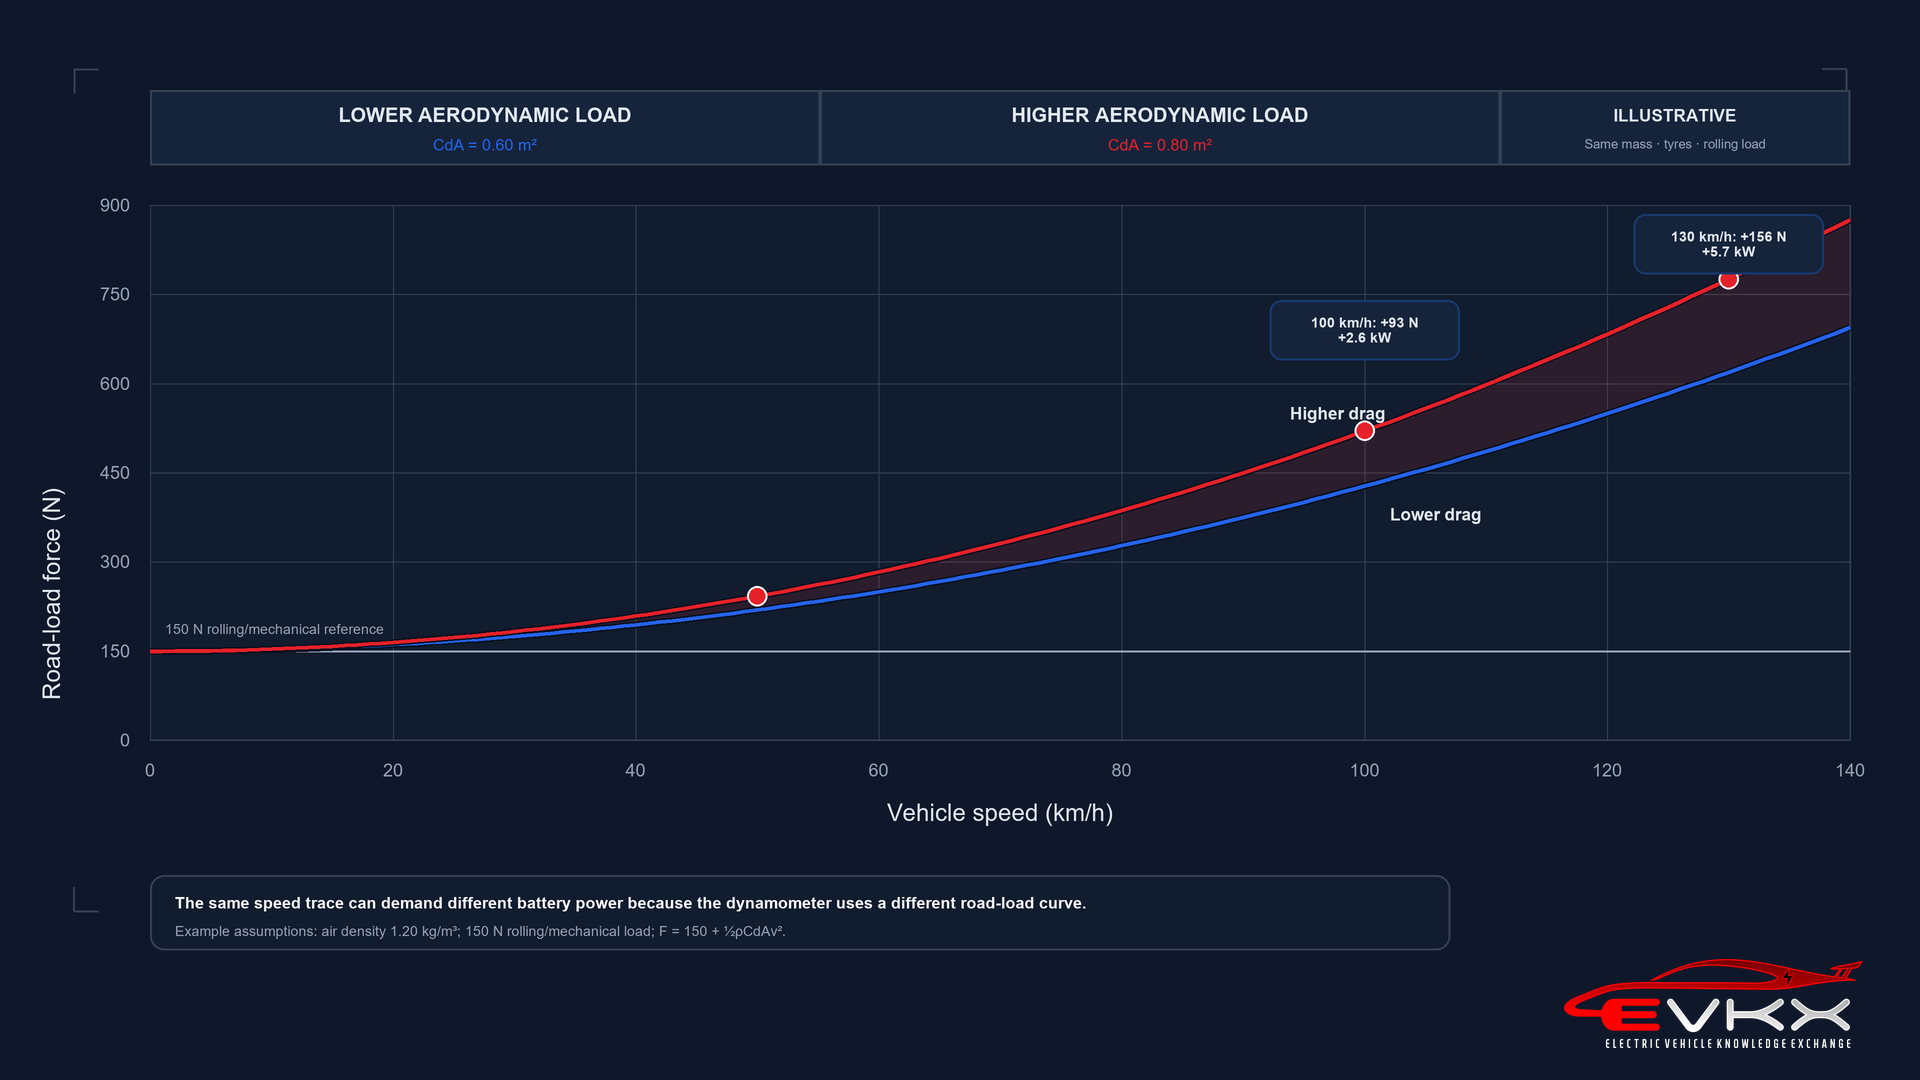
Because power is force multiplied by speed, aerodynamic power rises approximately with the cube of speed. Doubling speed does not merely double the aerodynamic demand. This is why a motorway test can expose differences hidden by a city-heavy cycle.
Rolling resistance can be approximated as:
F_roll = rolling-resistance coefficient × mass × gravity
Its coefficient changes with tyre construction, pressure, temperature, surface and load. Vehicle mass also increases the energy needed for acceleration and climbing, although regenerative braking can recover part of the kinetic and potential energy later.
The other principal forces are:
F_grade = mass × gravity × sin(road angle)
F_acceleration = effective mass × acceleration
Wheel power is the sum of the required forces multiplied by vehicle speed. Battery power must then account for inverter, motor, gearbox and battery losses, plus auxiliaries such as cabin heating, cooling, pumps, computers and lights. During deceleration, regenerative braking makes battery power negative until motor, battery, traction or comfort limits prevent further recovery.
Energy is power accumulated over time:
trip energy = integral of battery power over the trip
This explains why no single “efficiency” percentage can predict every journey. Motor efficiency changes with torque and speed, auxiliary loads matter more on slow short trips, and aerodynamic drag dominates a growing share of demand at high speed.
How a stationary dynamometer recreates the road
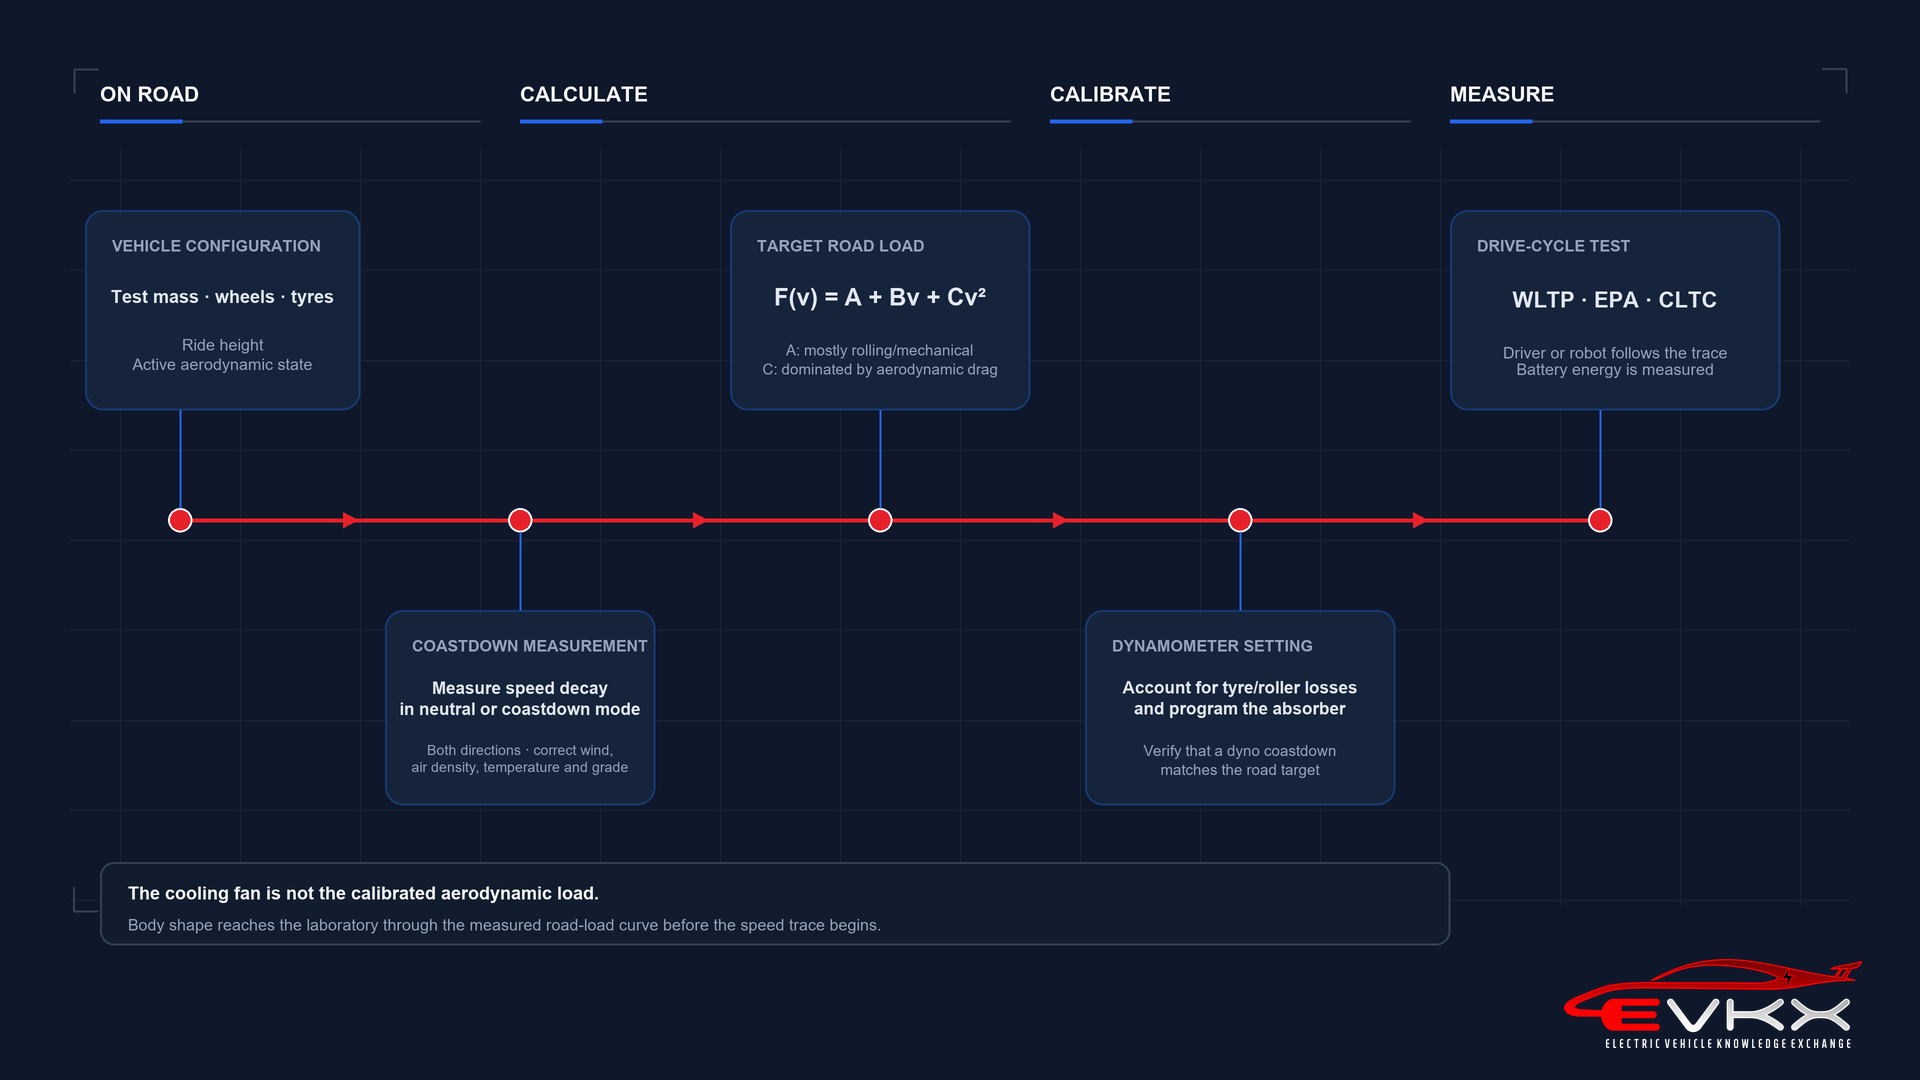
A chassis dynamometer does not need a wind tunnel around the test vehicle. Before the drive-cycle test begins, the laboratory determines the resistance that the represented vehicle experiences on a real road and programs the dynamometer to reproduce it at the wheels.
The measurement chain has five stages:
- Define the represented configuration, including test mass, wheels, tyres, tyre pressure, ride height and the state of active aerodynamic equipment.
- Characterize its road load. A common route is a coastdown test in which the warmed vehicle decelerates in neutral or a dedicated coastdown mode while speed and time are recorded in both directions.
- Correct the observations for permitted influences such as wind, air density, temperature and road gradient, then fit a force-versus-speed curve.
- Derive the dynamometer settings and verify that a dynamometer coastdown reproduces the road target.
- Run the applicable speed trace while measuring battery energy.
Road load is commonly written as:
F(v) = A + B × v + C × v²
The constant term is influenced mainly by rolling and mechanical resistance. The quadratic term is dominated by aerodynamic drag, which is why body shape, frontal area, wheel airflow and ride height matter increasingly as speed rises. The coefficients are empirical properties of the complete test vehicle; they should not be treated as a perfect separation of individual losses.
The target road-load coefficients and the dynamometer settings are related but not necessarily identical. Tyre deformation on the rollers, bearing losses and the dynamometer hardware already create some resistance. The electric absorber applies the remaining load required for the complete laboratory system to match the target. Regulators therefore require a calibration or coastdown check rather than asking the operator to copy one coefficient set blindly. U.S. EPA: Determination and Use of Vehicle Road-Load Force and Dynamometer Settings UNECE: UN Regulation No. 154, Worldwide harmonized Light vehicles Test Procedure
A fan normally provides cooling airflow to the vehicle and laboratory equipment. It is not relied on as the calibrated source of aerodynamic drag. The rollers reproduce the aerodynamic energy demand through their speed-dependent resistance.
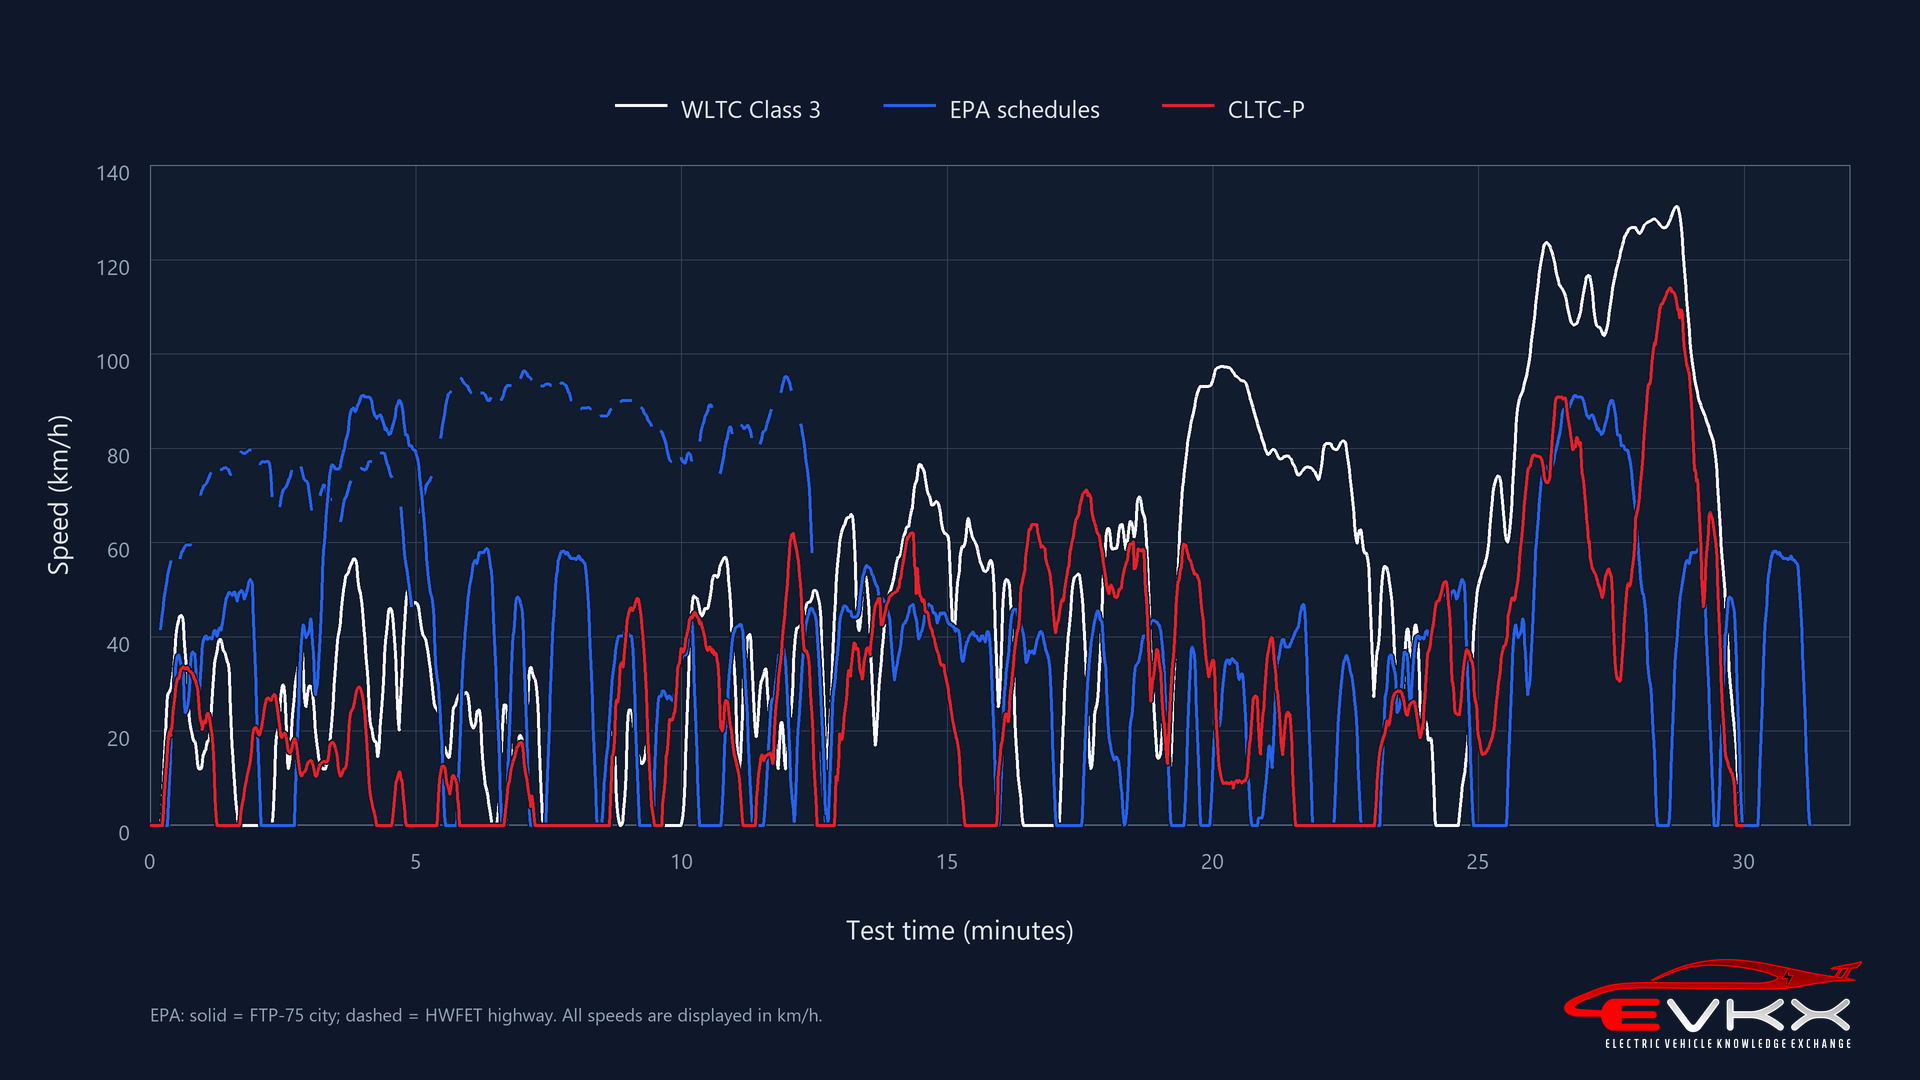
The same physical chain applies across WLTP, EPA and CLTC, although the permitted road-load methods, family rules, corrections and audit processes differ. A cycle graph alone is therefore not a complete test standard.
WLTP, EPA and CLTC do different jobs
WLTP is a type-approval procedure used in Europe and many other markets. Its passenger-car cycle contains low, medium, high and extra-high speed phases. Vehicle-specific values can be interpolated between tested configurations in the same family. The EV procedure measures usable battery energy and cycle energy consumption, then derives electric range. See How WLTP EV range is calculated.
The United States EPA label combines city and highway results after applying one of the permitted adjustment paths intended to make laboratory values more representative of use. Label energy consumption includes AC charging losses, while the range calculation also depends on measured DC discharge data. See How EPA EV range and efficiency are calculated.
China’s CLTC-P is more urban and lower-speed than the European cycle. Its official procedure still contains much more than a speed trace: road load, test mass, battery preparation, repeated or shortened depletion testing and result calculations all matter. See How CLTC EV range is calculated.
NEDC remains relevant to older EV specifications and several regional transitions, but it is no longer a current peer to those three systems in Europe. Its four repeated urban cycles and one extra-urban segment belong in the separate legacy and regional standards chapter. See Legacy and regional EV range standards.
The numbers cannot be converted with a universal percentage. A car that is exceptionally efficient at low speed can change position relative to another car at 120 km/h. Heating strategy, thermal mass, wheel choice and usable battery energy introduce further vehicle-specific differences.
Certified range is not a real-world promise
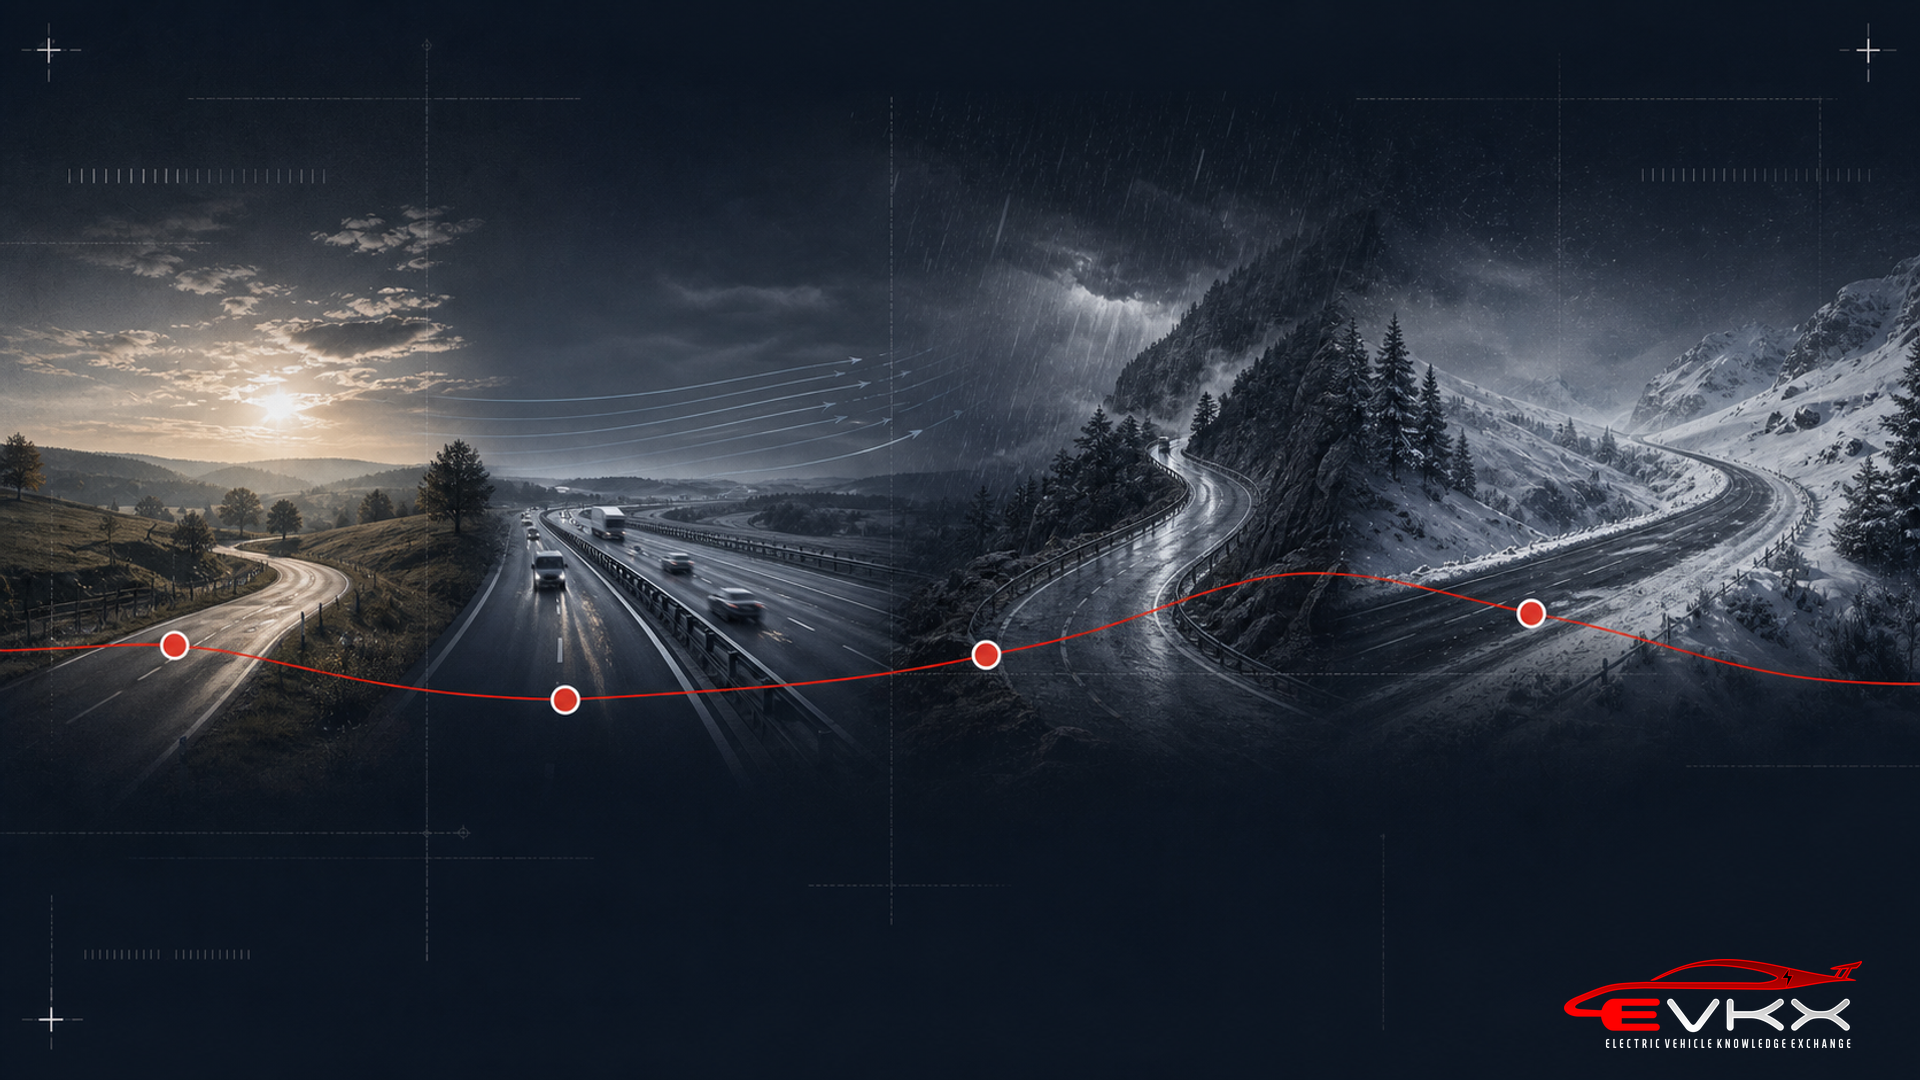
Certification removes variables so vehicles can be compared under repeatable conditions. A journey adds the variables back.
Speed is often the largest motorway lever. An Oak Ridge National Laboratory analysis found a median range reduction of about 15% for each 10 mph increase across the tested highway-speed intervals, with substantial differences between vehicles. That result is a cohort observation, not a conversion rule for every EV. Oak Ridge National Laboratory: Consumer-Oriented Energy Use and Range Metrics for Battery Electric Vehicles
Cold weather raises air density and rolling resistance, slows battery chemistry and creates heating demand. Short winter journeys can be especially inefficient because the cabin and battery may be heated repeatedly without enough distance to spread that energy cost. Preconditioning while connected to external power can move some of the demand away from the battery, but it does not remove the physical need for heat. U.S. Department of Energy: Impact of Cold Ambient Temperature on BEV Performance
Rain and standing water increase tyre losses. Headwind changes the air speed seen by the car: driving at 100 km/h into a 20 km/h headwind creates aerodynamic conditions closer to 120 km/h through still air. Elevation changes potential energy by approximately mass × gravity × height, with only part recoverable on the descent.
Payload, roof boxes, trailers and open windows alter mass or drag. Wheel and tyre options can change both. Cabin temperature, battery conditioning, traffic flow and driving style can then shift the remaining demand.
How an EV estimates its remaining range
An EV stores energy, not kilometres or miles. The distance shown beside the battery gauge—often called the range estimate, distance to empty or “guessometer”—is a forecast of how far the remaining usable energy may take the vehicle.
A simplified relationship is:
estimated remaining range = remaining usable energy / predicted consumption
If 60 kWh remains and the vehicle predicts 20 kWh/100 km, the estimate is 300 km. If predicted consumption rises to 25 kWh/100 km after colder weather or repeated short journeys, the estimate falls to 240 km even though the battery still contains the same 60 kWh.
The predicted-consumption input is manufacturer-specific. Adaptive systems can use recent energy consumption, speed and acceleration, outside temperature, cabin heating or cooling, other electrical loads, terrain and route information. Hyundai, for example, says its distance-to-empty estimate can reflect driving habits, electrical loads, weather, temperature, terrain, state of charge, battery temperature and battery health. When a destination is set, route information can replace learned energy-economy history in the calculation. Hyundai: Distance-to-empty calculation and influencing factors
Other displays deliberately use a fixed rated-consumption value. Tesla states that the main distance display in Model 3 estimates remaining range from battery energy and rated consumption, so it may not reflect personal driving or external conditions. Its Energy app separately calculates projected range from recent average consumption and provides route-based trip projections. Tesla Model 3 Owner's Manual: Range display and Energy app A range number therefore cannot be interpreted correctly without knowing which display and method produced it.
This explains a common autumn complaint. Colder weather, more heating and less efficient short-trip operation can make an adaptive estimator predict higher consumption and show fewer kilometres at 100%. The battery can still be fully charged: 100% describes its state of charge, while the kilometre figure describes a forecast. Hyundai warns that resetting learned driving patterns may raise the displayed estimate without increasing actual range, and that a winter reduction caused by low battery temperature is not necessarily permanent. Hyundai: Distance-to-empty calculation and influencing factors
The same distinction applies when a charging screen reports kilometres or miles added. The charger transfers energy, measured in kWh. Any distance added is a conversion based on an assumed consumption value; it is not distance stored inside the battery.
A changing estimate is not, by itself, evidence of battery degradation. Battery health should be assessed from repeatable capacity evidence and comparable driving or discharge conditions, not from one dashboard prediction. For trip planning, a route-aware arrival state-of-charge estimate can be more useful than a generic distance-to-empty number because it can account for the planned road rather than only a fixed or historical consumption assumption.
The practical rule is simple: a battery is filled with energy, not distance. At 100% state of charge, it is full even if the dashboard predicts fewer kilometres than it showed in warmer weather.
How to estimate a trip honestly
Start with a consumption figure measured under conditions close to the planned journey, not with a generic label conversion. Match speed, temperature, elevation, tyres and HVAC use as closely as the available evidence permits.
Then separate the calculation into explicit assumptions:
- Estimate usable energy at departure.
- Reserve the energy margin required at arrival.
- Estimate traction and auxiliary consumption for each distinct leg.
- Add elevation, weather, payload and accessory effects.
- Recalculate after charging stops using the expected departure state of charge.
For a simple leg:
distance = (departure energy − arrival reserve) / expected consumption
Keep units consistent. With energy in kWh and consumption in kWh/100 km, multiply the result by 100. Treat the answer as a scenario with uncertainty, not a guaranteed stopping point.
Use the EVKX Range & Travel Calculator
The EVKX Range & Travel Calculator applies this relationship to vehicle-specific physical data and available consumption anchors. It can compare single-charge range, a fixed-distance journey or the distance possible within a time budget while varying speed, temperature, road condition, HVAC load, battery health, trim, trailer and—in Distance mode—aggregate elevation.
The result is still a modelled scenario, not a route guarantee. Several inputs are held constant across the calculation, and real traffic, wind, charger availability and other trip-specific events remain outside the model. The dedicated EVKX Range & Travel Calculator guide explains the calculation, inputs and limits.
How to read any range claim
Ask five questions before comparing two numbers:
- Which procedure, model year and market produced the value?
- Is it a certified combined, city or highway value, an OEM claim, or an independent test?
- Which wheels, tyres, powertrain and equipment were tested?
- Does the consumption value include charging losses?
- Were the two vehicles measured at the same speed, temperature, state-of-charge window and test end condition?
Matching headline numbers do not prove matching physical efficiency. They may reflect different battery sizes, cycle strengths, adjustment methods or rounding. The useful comparison is the complete chain from road load and measured energy to the published label.
Sources
- U.S. Department of Energy: All-Electric Vehicles
- Oak Ridge National Laboratory: Consumer-Oriented Energy Use and Range Metrics for Battery Electric Vehicles
- U.S. Department of Energy: Impact of Cold Ambient Temperature on BEV Performance
- How WLTP EV range is calculated
- How EPA EV range and efficiency are calculated
- How CLTC EV range is calculated
- Legacy and regional EV range standards
- U.S. EPA: Determination and Use of Vehicle Road-Load Force and Dynamometer Settings
- UNECE: UN Regulation No. 154, Worldwide harmonized Light vehicles Test Procedure
- BMW Group: BMW iX3 50 xDrive usable battery energy
- BMW USA: Preliminary BMW iX3 50 xDrive specifications
- BMW USA: BMW iX3 model overview and battery specification
- Hyundai: Distance-to-empty calculation and influencing factors
- Tesla Model 3 Owner's Manual: Range display and Energy app