
How EPA EV Range and Efficiency Are Calculated
An EPA label is produced from measured laboratory data, regulatory adjustment methods and manufacturer submissions reviewed under EPA rules. Understanding that chain is the only sound way to discuss both the value of the label and the latitude that has made some EV comparisons controversial.
What the EPA label reports
For a battery-electric vehicle, the U.S. label can show:
- combined, city and highway MPGe;
- combined electricity consumption in kWh/100 miles;
- estimated combined driving range;
- annual energy-cost information and other consumer disclosures.
MPGe is an energy-equivalence metric, not a claim that the car burns gasoline. EPA assigns 33.705 kWh of energy to one gallon of gasoline equivalent. In simplified form:
MPGe = 33.705 kWh / electricity consumed per mile
A value of 105 MPGe corresponds to about 32.1 kWh/100 miles before display rounding. The label’s electrical consumption includes the energy drawn from the AC supply during charging, so charging losses are part of the consumer-facing efficiency result. U.S. EPA: Fuel Economy and EV Range Testing
Range is related but not identical. It is built from the energy discharged while driving, the measured city and highway distances or energy allocation, and the applicable adjustment method. Multiplying rounded label range by rounded kWh/100 miles is therefore not a reliable way to recover exact usable battery capacity.
Step 1: the manufacturer develops certification data
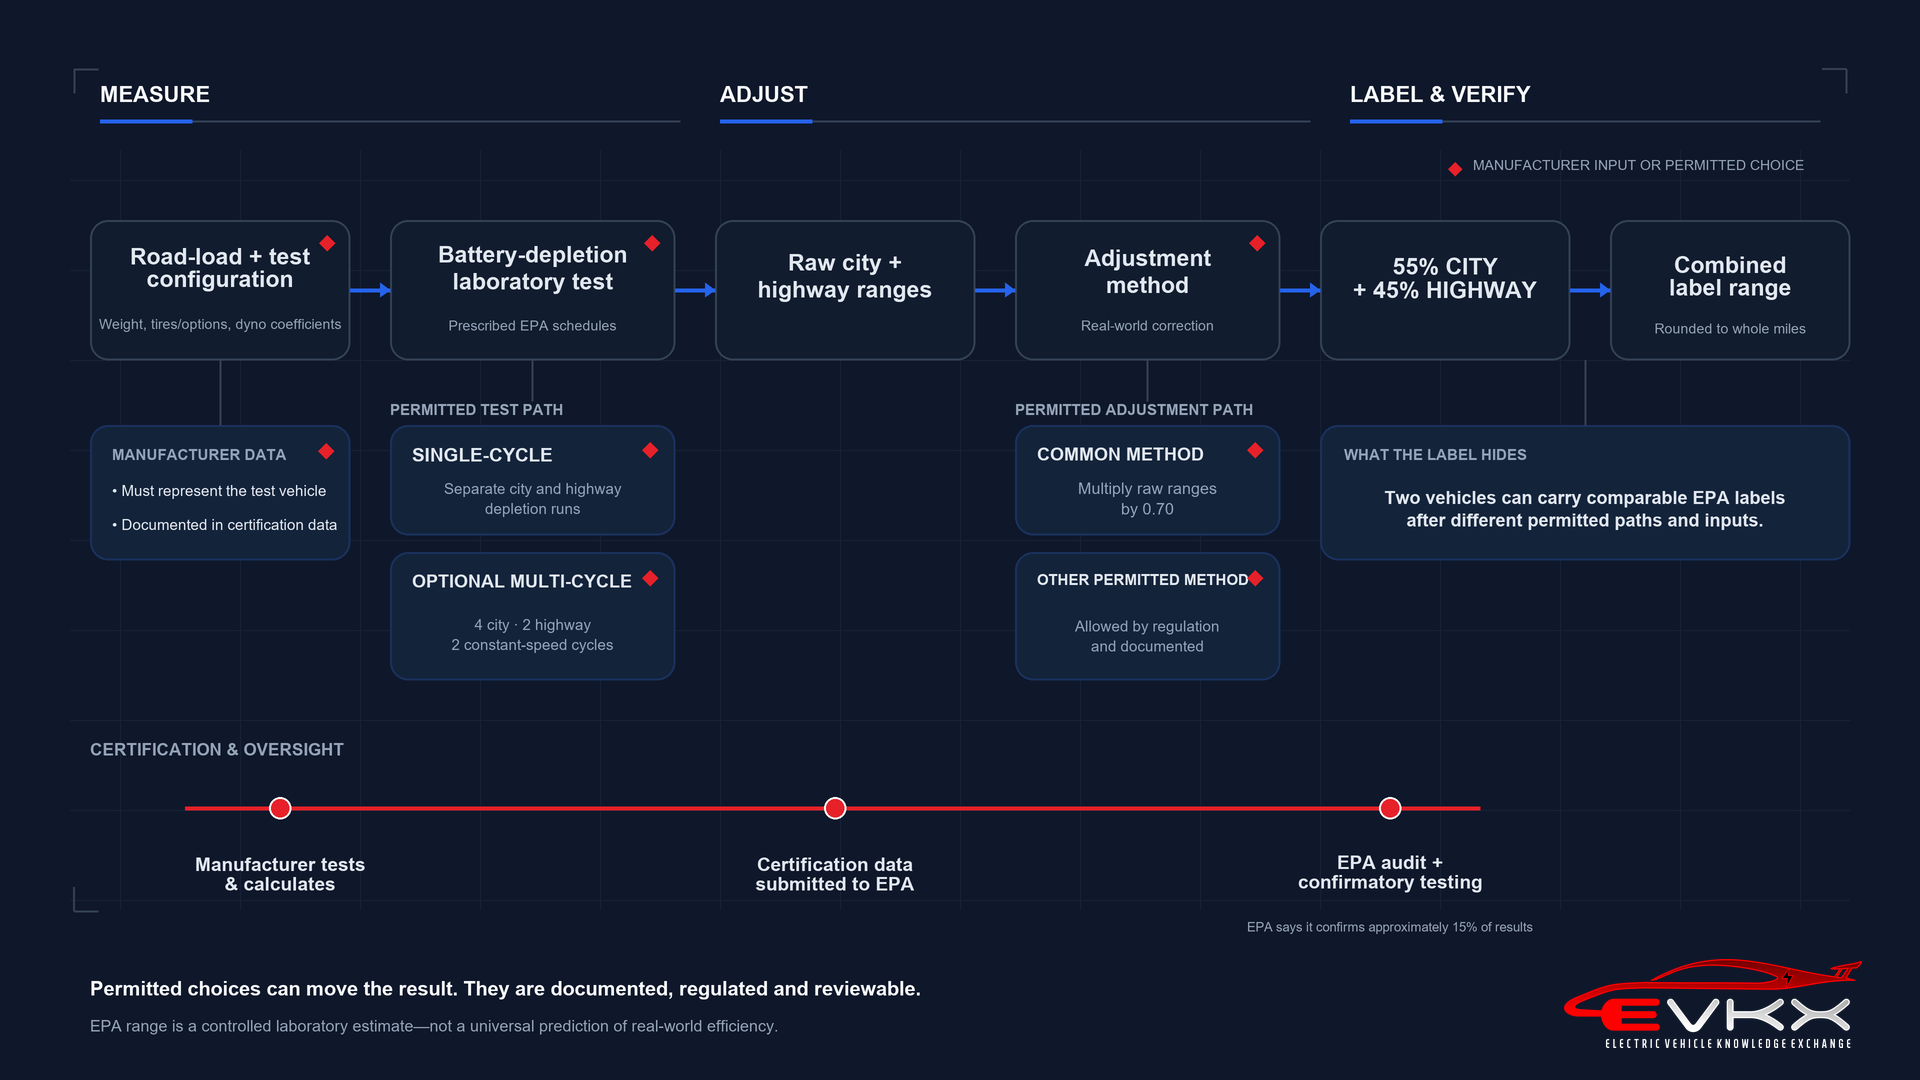
Manufacturers conduct most U.S. fuel-economy testing in their own or contracted laboratories under federal procedures. They submit the results, calculations and supporting information to EPA. EPA states that it confirms about 15% of vehicle test results through its own testing, with vehicles selected for reasons that include new technology, high sales volume, data concerns and random checks. U.S. EPA: Fuel Economy and EV Range Testing
This division of work is central to the controversy. “EPA-rated” does not mean EPA engineers physically tested every configuration. It means the result was certified under EPA’s regulatory system. A useful audit question is therefore not merely who drove the dynamometer, but which data, adjustment path and approvals produced the label.
EPA can require additional testing, reject data and apply enforcement provisions. Public certification files and downloadable test data allow unusually deep investigation, although reconstructing a label often requires several datasets and regulatory definitions rather than one consumer page. U.S. EPA: Data on Cars Used for Testing Fuel Economy
Step 2: establish the vehicle and road load
The certification vehicle must represent the applicable test group and subconfiguration under EPA rules. Test weight, wheels, tyres, axle ratio, drive mode, ride height and active aerodynamic state can all affect the measured result.
EPA separates the work into two stages. First, the manufacturer characterizes the force the vehicle experiences during on-road operation. A common method is a coastdown test: a warmed vehicle decelerates in neutral or a dedicated coastdown mode while its speed is measured. Runs in opposite directions and corrections for wind, temperature, air density and gradient are used to obtain a representative road target.
That target is commonly written as:
F(v) = A + B × v + C × v²
The coefficients describe the complete vehicle. A is influenced mainly by rolling and mechanical resistance, while C is dominated by aerodynamic drag. They are empirical curve terms rather than a perfect physical separation. Body shape, frontal area, wheel airflow, cooling openings and ride height therefore reach the EPA test through the road-load coefficients.
Second, the target coefficients are converted into dynamometer set coefficients. Tyre-on-roller losses and other laboratory resistance already slow the vehicle, so the electric power absorber applies the remaining force required for the complete system to match the road result. The setting is checked with a dynamometer coastdown. A fan supplies cooling airflow; it is not the calibrated substitute for aerodynamic resistance. U.S. EPA: Determination and Use of Vehicle Road-Load Force and Dynamometer Settings
EPA permits alternative engineering routes, including analytical, wind-tunnel, tyre and component data, when they are properly supported and described. That flexibility does not remove accountability: the submitted target coefficients, road-load horsepower, dynamometer settings and methods form part of the certification record, and EPA may perform confirmatory coastdowns or require corrections.
Road load is therefore both legitimate engineering and a high-leverage audit point. Transparent comparisons should identify test weight, wheel and tyre configuration, target A/B/C coefficients, dynamometer coefficients, road-load horsepower and the state of active aerodynamic equipment. A lower quadratic coefficient reduces the simulated high-speed load throughout the test, so unexplained differences deserve examination rather than an assumption that every trim shares one physical result.
Step 3: fully charge and deplete the battery
The vehicle is charged and conditioned under the prescribed procedures, then driven on a chassis dynamometer until the rechargeable energy storage system reaches the regulated test end condition.
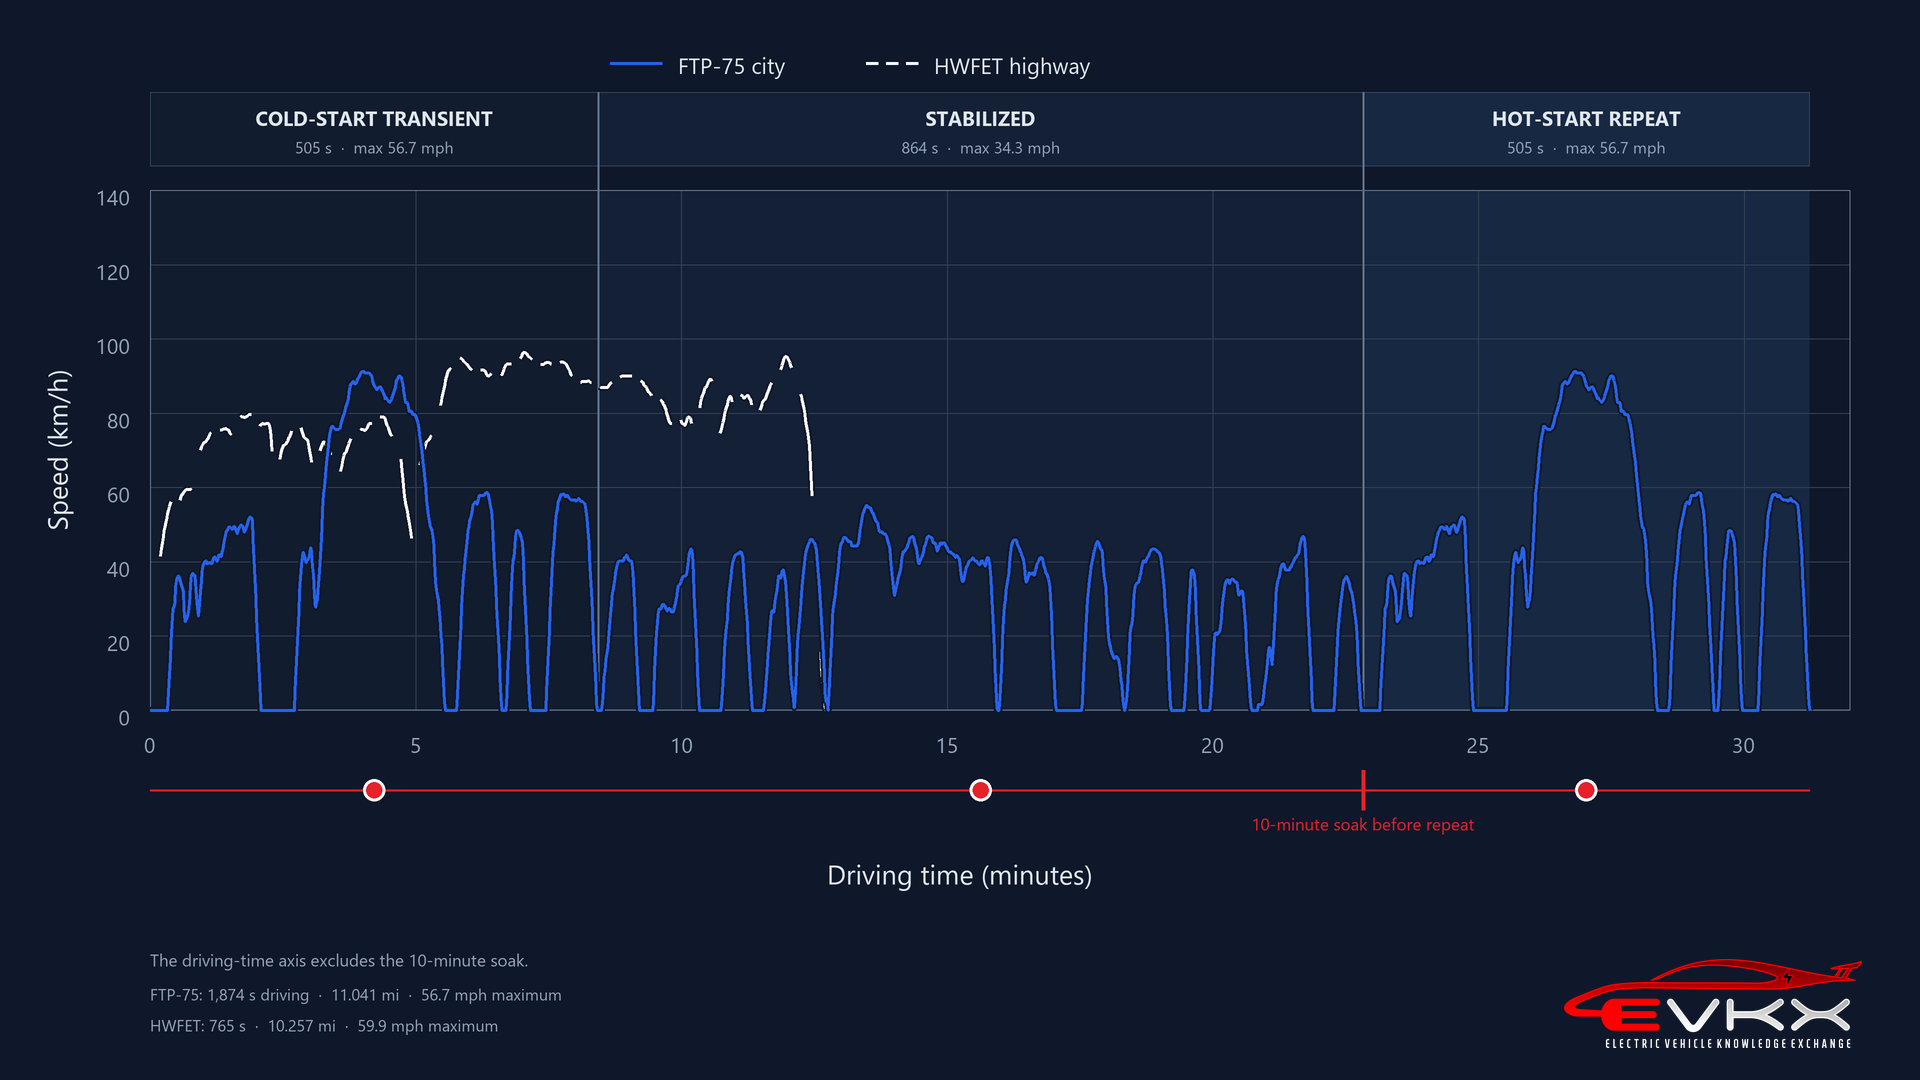
The two foundational schedules are:
- UDDS, the urban dynamometer driving schedule, used for city results;
- HWFET, the highway fuel-economy test, used for highway results.
The UDDS contains stops and transient urban operation. HWFET is smoother and faster, but its average and maximum speeds are lower than a modern 70 or 80 mph motorway cruise. Neither is a direct road-trip test.
EPA permits a single-cycle full-depletion approach for the city and highway determinations and an optional multi-cycle test procedure. The multi-cycle procedure combines specified city, highway and constant-speed segments so that usable battery energy and the allocation of energy consumption can be determined without performing a separate full depletion for every schedule. The regulations and EPA guidance define how DC battery data, distance and recharging energy are reported. U.S. EPA guidance CD-2022-15: Electric vehicle test data reporting
During the driving test, battery voltage and current provide DC discharge energy:
DC energy = integral of battery voltage × battery current over time
EPA’s public explanation describes the vehicle as being driven until the battery is depleted and the vehicle can drive no farther. The technical endpoint under SAE J1634 is operational: the test ends when depletion prevents the vehicle from following the required drive trace within its tolerance. Federal rules define usable battery energy as the total measured DC discharge energy from the phases of the full-discharge test; energy discharged during key-off soak periods is excluded. U.S. EPA: Fuel Economy and EV Range Testing 40 CFR 600.116-12: Special procedures related to electric vehicle driving range
Displayed 0% is not itself the EPA end-of-test trigger. If the vehicle reaches 0% but can still follow the prescribed trace, the subsequent DC discharge can be included in usable battery energy. The test stops when the vehicle can no longer perform the schedule, while the battery-management system retains energy below the propulsion cutoff to protect the cells.
Near empty, available energy can depend on the requested power. Voltage sag may prevent a vehicle from meeting a speed or acceleration target even though a gentler load could extract a little more energy. “Full discharge test” therefore means full discharge under the regulated procedure, not destructive discharge to electrochemical zero.
After the depletion test, the battery is recharged. The AC energy measured at the electricity supply captures losses in the charging equipment, onboard charger and battery charging process. EPA’s consumer energy-consumption value is based on this wall-energy boundary.
Case study: BMW iX3 capacity figures
The BMW iX3 50 xDrive demonstrates why a regional manufacturer specification should not automatically be interpreted as EPA-measured usable battery energy.
BMW’s September 2025 U.S. specifications listed 112.2 kWh as “net usable energy content,” but marked the complete table “preliminary – subject to change.” BMW USA: Preliminary BMW iX3 50 xDrive specifications BMW’s April 2026 global material states that the iX3 50 xDrive provides 108.7 kWh of usable energy for the German-market WLTP result. BMW Group: BMW iX3 50 xDrive usable battery energy BMW’s current U.S. consumer page now describes 112.3 kWh as total capacity rather than usable capacity. BMW USA: BMW iX3 model overview and battery specification
Those publications do not establish that the U.S. EPA procedure accesses 3.5 kWh more energy below displayed 0%. The 112.2 kWh figure was preliminary manufacturer data, not a cited result from an EPA full-discharge record, and the later U.S. wording changes the measurement boundary.
Comparing the current 112.3 kWh total figure with the 108.7 kWh usable figure leaves an arithmetic gap of 3.6 kWh. That difference could contain upper and lower protective margins, rounding and field-definition differences. It cannot reveal how the reserve is divided or how much remains available after the dashboard reaches 0%.
Identical physical cells and pack construction would not by themselves prove identical software windows, but the available BMW sources also do not demonstrate a U.S.-specific calibration. Evidence of a below-zero reserve requires a discharge trace that records displayed state of charge and DC energy, battery-management data or an explicit manufacturer definition.
Step 4: turn laboratory cycles into label values
Raw city and highway results are not printed directly on the window label. EPA applies an adjustment intended to reflect conditions absent from the basic UDDS and HWFET tests.
The familiar default route multiplies raw range by 0.7:
adjusted city range = raw city range × 0.7
adjusted highway range = raw highway range × 0.7
This 30% reduction is deliberately conservative, but it is not the only permitted path. Federal rules require label values to be based on five-cycle results or an allowed five-cycle-equivalent method. A manufacturer can use vehicle-specific data and methods prescribed or approved under the regulations, including procedures connected to SAE J1634, rather than the fixed 0.7 factor. EPA approval or concurrence is required where the rule specifies it. 40 CFR 600.116-12: Special procedures related to electric vehicle driving range
The complete five-cycle framework adds conditions that the two basic schedules do not represent:
- US06 for aggressive driving and higher speed;
- SC03 for air-conditioning operation in hot conditions;
- a cold-temperature urban test;
- the normal-temperature city and highway schedules.
For model year 2025 and later battery-electric vehicles, the cold procedure and submitted calculation requirements are more explicit. Manufacturers can have choices defined by the regulation, such as initial state of charge for the cold test, but must report the results and supporting information and obtain EPA concurrence where required.
The adjusted city and highway ranges are combined using the statutory label weighting:
combined range = 0.55 × adjusted city range + 0.45 × adjusted highway range
The displayed range is rounded to a whole mile. Consumer-facing MPGe and kWh/100 miles are also rounded. Two cars can therefore share a displayed efficiency value even when their unrounded values differ.
What manufacturers can and cannot choose
The loose claim that an OEM can define any process it wants is wrong. The cycles, test conditions, reporting duties and available adjustment routes are governed by federal regulations. EPA can test vehicles, request data and deny an unsupported method.
There is still meaningful latitude inside the system:
- the manufacturer normally generates the certification data;
- several regulated routes can produce five-cycle or five-cycle-equivalent label values;
- vehicle-specific adjustment factors may differ from the default 0.7 when supported and approved;
- certification families and tested configurations determine how results cover sale vehicles;
- road-load determination and engineering data require judgment within regulated limits;
- displayed values compress unrounded data through weighting and rounding.
Manufacturers may voluntarily make a label more conservative by lowering MPGe or range, or by increasing reported kWh/100 miles. The regulation does not permit a manufacturer simply to raise range or MPGe as a voluntary label adjustment. 40 CFR 600.210-12: Fuel economy label calculation procedures
This creates an asymmetric system: the label is standardized, yet the path to it is not always identical from one vehicle to another. A fair criticism should identify the specific permitted method, factor or input that changes the comparison. “Creative” is useful only when it can be translated into an auditable claim.
Case study: Rivian R2 and Tesla Model Y
The 2027 Rivian R2 Performance on 21-inch wheels and the 2026 Tesla Model Y Performance provide a timely example. Their published labels both show 105 MPGe combined and 32 kWh/100 miles, although the R2 is rated at 330 miles and the Model Y at 306 miles. The city and highway values already reveal a difference hidden by the combined headline: reported figures put the R2 at 114 MPGe city and 96 highway, while the Model Y is at 111 city and 100 highway. Electrek: Rivian R2 and Tesla Model Y EPA label comparison
An independent side-by-side comparison by Out of Spec Reviews and RivianTrackr then found materially higher indicated energy use in the R2. InsideEVs reported gaps of 18.4% at 50 mph, about 26% at 60 mph, about 20% at 70 mph and 26.5% at 80 mph. Its report also describes roughly 25% higher consumption in a low-speed stop-and-go simulation. InsideEVs: Rivian R2 and Tesla Model Y side-by-side efficiency test report
That test is strong enough to challenge the casual statement that the vehicles have equal real-world efficiency. It is not a substitute certification test and does not prove misconduct:
- the routes were relatively short;
- traffic and nearby trucks affected at least one segment;
- the comparison used consumption reported by each vehicle rather than independently metered battery or charger energy;
- one pair of vehicles cannot establish production-wide variation;
- drive-mode and thermal-control behavior may differ even with matched cabin settings.
The most defensible conclusion is narrower: the same rounded combined EPA figure did not predict the observed speed-specific energy use in this comparison.
The report says the vehicles appear to have reached their labels through different EPA test routes, with the R2 undergoing a full five-cycle test and the Model Y using a derived route. That is a reported interpretation, not proof that the route caused the entire gap. The certification files, raw test records, road loads and exact adjustment calculations should be reconstructed before assigning causation.
The case exposes four weaknesses in headline-only comparison:
- Combined MPGe blends 55% city and 45% highway, so different city/highway shapes can converge.
- MPGe and kWh/100 miles are rounded, hiding smaller differences.
- A vehicle-specific approved adjustment can separate the label result from the default 0.7 path.
- EPA highway weighting does not equal continuous high-speed cruising.
There is no evidence in this comparison alone that Rivian violated EPA rules. There is good evidence that consumers need the underlying city, highway, test-route and unrounded data before interpreting “same EPA efficiency” as a physical equivalence.
How EPA reporting could become clearer
A more transparent consumer record would publish, in machine-readable form beside every label:
- raw city and highway range and consumption;
- the exact adjustment route and factors;
- unrounded adjusted values;
- road-load coefficients, test mass, wheel and tyre specification;
- test mode and thermal-conditioning state;
- measured usable DC battery energy;
- AC recharge energy and charging-loss percentage;
- the source test IDs used for each label value.
EPA already publishes much of the underlying certification material, but it is fragmented and difficult for a consumer to join. A single calculation ledger would make legitimate vehicle-specific methods visible and make questionable comparisons easier to test.
How to use an EPA number
Use combined EPA range for standardized mixed-driving comparison. Use EPA city and highway values to see whether the combined number hides a speed-profile difference. For road-trip planning, prefer a controlled constant-speed test at the intended speed and temperature.
When comparing efficiency, check the measurement boundary. EPA label kWh/100 miles includes AC charging losses; many road tests display battery-to-wheel energy reported by the car. Both can be useful, but they answer different questions.
The EPA label is neither a fraud nor a physical constant. It is a regulated estimate whose meaning becomes much clearer once the test path, adjustment and energy boundary are visible.
Sources
- U.S. EPA: Fuel Economy and EV Range Testing
- U.S. EPA: Data on Cars Used for Testing Fuel Economy
- 40 CFR 1066.301: Overview of road-load determination procedures
- U.S. EPA: Determination and Use of Vehicle Road-Load Force and Dynamometer Settings
- U.S. EPA guidance CD-2022-15: Electric vehicle test data reporting
- 40 CFR 600.116-12: Special procedures related to electric vehicle driving range
- 40 CFR 600.210-12: Fuel economy label calculation procedures
- U.S. EPA: 2027 Rivian R2 certification summary information report
- U.S. EPA: 2026 Tesla Model Y certification summary information report
- Electrek: Rivian R2 and Tesla Model Y EPA label comparison
- InsideEVs: Rivian R2 and Tesla Model Y side-by-side efficiency test report
- BMW Group: BMW iX3 50 xDrive usable battery energy
- BMW USA: Preliminary BMW iX3 50 xDrive specifications
- BMW USA: BMW iX3 model overview and battery specification